Examining traditional asset correlation during both Bull and Bear Markets
By: Kirk Chisholm & Joseph W. Chase
Click here to read this article as a PDF.
Markowitz’s Modern Portfolio Theory shows that a diversified portfolio of low-correlation assets provides an optimal risk/return relationship. Investors traditionally invest in a mix of assets such as stocks, bonds, and mutual funds (“traditional assets”), believing that they are forming a diversified, low-correlation portfolio by doing so.
However, our research shows that diversification among several traditional asset classes is not effective during bear markets because those assets become highly correlated, more so than they do during bull markets. Additionally, over the past decade, traditional assets have become much more correlated, suggesting traditional diversification is losing its effectiveness.
We have examined the correlation of returns for 10 traditional assets during bull and bear markets over the past 25 years. Using historical regression analysis, we examined the coefficient of determination (R-squared) between each pair of assets. The R-squared reflects how much of one asset’s price change is determined by another asset’s change.
For example, if assets A and B have an R-squared of 0.6, 60% of A’s movement is determined by B. Ideally, investors want the lowest R-squared possible among assets in their portfolios. This will allow said assets to move more independently of one another, thus providing proper diversification.
We have identified the following time periods as bull markets:
- January 1st, 1985 – October 19th, 1987
- December 4th, 1987 – July 13th, 1990
- January 11th, 1991 – September 1st, 2000
- March 7th, 2003 – October 12, 2007
We have identified the following time periods as bear markets:
- October 19th, 1987 – December 4th, 1987
- July 13th, 1990 – January 11th, 1991
- September 1st, 2000 – March 7th, 2003
- October 12th, 2007 – March 9th, 2009
We have examined the following traditional assets to represent global diversification:
| US Equity | International Equity | Commodities | Debt |
| NASDAQ Composite | EAFE Index | Gold | AAA Corporate Bonds |
| S&P 500 | Hang Seng Index | Crude Oil | High Yield Bonds |
| Dow Jones Industrial | Nikkei 225 | DJ-AIG Commodity Index | |
| Small Cap US Equity | BSE Sensex |
We created a correlation matrix among all asset classes for each bull and bear market and then took the average correlation between each asset class and all the others. This data results in an average correlation among all assets for each market since 1985, as shown in Chart 1 (Bull and Bear Asset Correlation).
Chart 1:
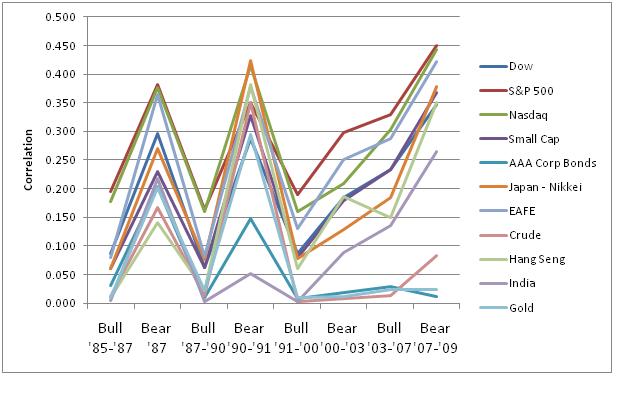
Our data analysis provided two conclusions:
- In general, there is significantly more correlation among asset classes during bear markets compared to bull markets.
- The level of correlation between traditional asset classes has increased dramatically in the past decade compared to the prior 15 years.
As shown in Chart 2 (Bull Market: November 2004 to September 2007), asset correlation followed the pattern of rising during bear markets and declining during bull markets. That is until the bull market of 2003-2007, during which time all assets became more correlated on average (with the exception of the Hang Seng index). During the most recent bear market, AAA corporate bonds were the only asset to become less correlated on average compared with the 2003-07 bull market.
Chart2:

What does this mean for investors?
Diversification is a great risk management tool during bull markets due to its ability to reduce volatility, smooth portfolio returns, and help mitigate individual asset risk. This means that in a properly diversified portfolio, some securities will outperform the market, and some will underperform, but overall the portfolio should provide more consistent returns as opposed to the sometimes wild fluctuations inherent in any one asset. The growth in index funds or ETFs is an example of this interest in proper diversification. When investment is restricted to an index, it helps eliminate individual security risk. While proper diversification is beneficial, over-diversification may not add value and may even hinder performance according to Markowitz’s Modern Portfolio Theory.
During Bear markets, many assets tend to correlate more highly and can defeat the general purpose of the strategy. There are a few reasons for this, but the simplest explanation is that asset prices increase primarily on fundamentals. For example, countries with rapidly expanding economies will see their stock indices grow faster, and commodities with especially high demand will see their prices increase more than others. However, during bear markets, financial institutions, mutual funds, hedge funds, and pension funds liquidate holdings to meet investor redemptions and other liquidity needs, rather than selling for fundamental reasons, which can cause asset prices to drop across the board. This activity can trigger stop losses and other risk mitigation methods causing further selling (e.g., creating waterfall price drops that can cause portfolio managers to act in ways they did not intend.) In 2008, the liquidations made the selloff worse by the amount of leverage being used by financial institutions and hedge funds. When portfolio managers must engage in major liquidations, they tend to close out their more favored assets first since these can provide the easiest way to raise cash. Although this may be counterintuitive, when liquidity is the primary concern, everything else takes a backseat to this goal.
As shown in Chart 2 (Bull Market: November 2004 to September 2007), diversification would provide total returns of nearly 70% in less than three years by forming an equally weighted portfolio of small-cap, gold, S&P 500, Nasdaq, Hang Seng, BSE Sensex, and Treasuries. Although treasuries grew by just 12.6% in that time, developing countries provided growth of over 100%, demonstrating that diversification would have been very effective during this particular bull market.
Conversely, as seen in Chart 3 (Bear Market: October 2007 to October 2008) in just over one year following the markets’ peak, the same equally weighted portfolio would return -31.6%. Treasuries again returned just under 13%, but the collapse of everything else caused a net loss. For most passive investors who did not rebalance their portfolios at the market peak to an equal weighting, the loss would be -33.4%.

The other conclusion drawn from our research is that correlation between these referenced assets has increased over time. Prior to 2000, bull markets had an average correlation of between .062 and .072, and bear markets ranged between .259 and .310. This means that the correlation between these traditional assets is about 2.5 times higher during bear markets compared with bull markets.
After 2000, there was a material change in asset correlation. The bear market of 2000-03 had a correlation of just 0.142, about half that of previous bear markets. During the bull market that followed, the correlation was higher than that of the preceding bear market, with an average correlation reading of 0.175. During the most recent bear market, the correlation was the second highest of any market, reaching .286.
Our conclusion is that as the world becomes smaller, correlations should be expected to increase. As people invest in a greater number of markets in search of low-correlation assets, we expect these sought-after markets to become more correlated as a result of increased interest. Over time, investors have gained greater access to international markets, commodities, and other assets which were difficult to invest in previously. So when investors liquidate entire portfolios, they are likely to be sold in many different markets and most likely the more prized assets in search of liquidity. When investors buy back into the market, they will choose more carefully than when selling. Based on this information, we have concluded that investing in non-widely held assets is the best way to achieve true diversification. Non-widely held assets that continue to spin off cash flows during all markets are the most desirable. By investing in off-exchange or non-widely held assets that provide stable cash flows, investors may be able to shield a portion of their portfolio from the broad downturns that are likely to decimate a portfolio of highly correlated traditional assets.
Sources: Bloomberg, The Federal Reserve, and the Investment Company Institute.
About Innovative Advisory Group: Innovative Advisory Group, LLC (IAG), an independent Registered Investment Advisory Firm, is bringing innovation to the wealth management industry by combining both traditional and alternative investments. IAG is unique in that they have an extensive understanding of the regulatory and financial considerations involved with self directed IRAs and other retirement accounts. IAG advises clients on traditional investments, such as stocks, bonds, and mutual funds, as well as advising clients on alternative investments. IAG has a value-oriented approach to investing, which integrates specialized investment experience with extensive resources.
For more information you can visit www.innovativewealth.com
About the authors:
Kirk Chisholm, is a Wealth Manager and Principal at Innovative Advisory Group. His roles at IAG are co-chair of the Investment Committee and Head of the Traditional Investment Risk Management Group. His background and areas of focus are portfolio management and investment analysis in both the traditional and non-traditional investment markets.
Joseph W. Chase, written as a research intern at Innovative Advisory Group (formerly NUA Advisors). Joe graduated summa cum laude with a BSBA in finance from Suffolk University in Boston, MA in 2009.
Disclaimer: This article is intended solely for informational purposes only, and in no manner intended to solicit any product or service. The opinions in this article are exclusively of the author(s) and may or may not reflect all those who are employed, either directly or indirectly or affiliated with Innovative Advisory Group, LLC.