
Investor Behavior – “You can bury your head in 10q’s and 8k’s and memorize a thousand facts about a company. You can become an expert on a given stock sector and establish relationships with all of the executives who run the show. You can build your own DCF models and outguess the other guessers on earnings estimates and forward guidance. But until you accept that market mood and behavior is as big a factor as the fundamentals, you won’t ever be completely honest with yourself. The E is only half of the PE. No matter how good you are at understanding and predicting the E, you’ve still only got half the story. The P is determined entirely by psychology.”
– (The Reformed Broker)
In August of 2015, the stock markets around the world were once again shocked to see stock indexes drop significantly in a matter of days. The biggest drop happened on Monday, August 24th at the opening bell at 9:30am EST.
The total drop in 3 days accounted for 11.7% in the S&P 500 futures. Yes, this happened in 3 days.
On Monday the 24th from open to the low of the day the S&P 500 dropped 6.8%. The Dow lost more than 1000 points early in the day.
What did this have to do with earnings? Very little from what I could tell. However, stocks don’t always move based on earnings, or fundamental influences.
So what happened?
I would like to recap those few trading days in August to illustrate a point about markets. They are not always rational, and they move based on more than just fundamental news or earnings.
What moves markets – 35 Investments during the August 2015 Crash?
Stock and bond markets around the world move for a variety of reasons. They move on company news, earnings reports, interest rates, international markets, money flows, political news, and more. In the case of August 20, 21, and 24. The news media attributed the moves to factors such as China, uncertainty of the Fed decision and other international markets.
I won’t deny that China’s Shanghai Composite index dropping approximately 8% probably had something to do with the US stock market drop. However was that the primary reason? Could there be other reasons as well?
I don’t expect to unveil all the markets secrets today, but I can tell you that the reasons given in the media for movements in equity markets are not always accurate.
30 Stocks of the Dow Jones Industrial Average (DJIA)
Here are charts of each of the Dow 30 stocks for the period of August 20,21,24 and subsequent trading days afterward.
Exxon Mobil

Walmart

Verizon

Visa

United Technologies

United Health Group

Travelers

Proctor & Gamble

Pfizer

Nike

Microsoft

Merck

3M

McDonalds

Coca Cola

JP Morgan Chase

Johnson & Johnson

Intel

IBM

Home Depot

Goldman Sachs

General Electric

Walt Disney

DuPont

Chevron

Cisco

Caterpillar

Boeing

American Express

Apple

You may notice that most of the charts above look very similar. Some are certainly more volatile than others, but most stocks move with a similar correlation to each other. Every one of these 30 stocks was affected by the large 3-day drop of US stocks. You should note that these 30 stocks are some of the largest and widely owned in the US markets. While the DJIA is only 30 stocks, the index is made up of stocks that have established themselves as important companies from diverse industries.
Is lack of liquidity a problem?
During this August correction, 4 companies (HD, JNJ, GE, and BA) had significant drops during the trading day of August 24th. While I cannot be certain of the reason for this, it appears to me as if the liquidity dried up in these 4 stocks for no specific reason.
It seems a bit odd to think about it this way, but in the case of JNJ, there were no buy orders above 81.79. JNJ is one of the most reputable companies in the US and 81.79 was the first buy order?
The stock closed on Friday, August 21 at 95.6. on Monday, August 24th the stock opened up and quickly dropped to 81.79. That is a drop of 14.5%. Was anything materially different in JNJ? Not that I could tell. But apparently, 81.79 was the first buy order the market could find. This is an indication of a lack of liquidity in the stock. While this is only one example, it could be an indication of liquidity starting to dry up in US markets.
This might not be a problem for the average retail investor, but it could be a problem for larger institutions and the markets as a whole. Some larger institutions may take 1-2 weeks to purchase enough shares to reach their ideal allocation. I have noticed a number of dislocations in the markets recently, so you should keep an eye out of this type of price action.
Let’s take a look at currencies.
Currencies
I think it is important to notice the money flow patterns here. In times of crisis, the US dollar and US treasuries are frequently destinations in a flight to safety trade by many traders around the world. It didn’t happen this way on August 20, 21, 24. As you can see below, money flows were exiting the US dollar and going into the Euro and Yen.
Are the Euro and Yen perceived as safer destinations than the US dollar? It appears so.
Another possibility is that Japanese and European investors were pulling their money out of the US and keeping it in cash in their own currencies. This seems more plausible to me. There is a lot of international money invested in US stocks because they are perceived to be the most stable stock market at the moment. Based on this data, it appears as if that may be changing.
US Dollar

Euro

Yen

Bonds
What about US treasuries?
It is hard to see on this chart, but leading up to August 24th, US treasuries were rising as you would expect with the stock markets dropping. however on August 24th, and for the next 4 days, US Treasuries dropped. This is not the typical the pattern I would expect from US bonds. The 30 year Treasuries were even more pronounced of a move down. When investors get scared out of stocks, they flee into bonds. Except for the August 24th open, treasuries dropped most of the day.
10 Year US Treasury

30 Year US Treasury

Aren’t US Treasuries supposed to be a flight to safety haven when investors are scared of stocks? Typically they are, but something was different on August 24th.
If you are expecting an answer of why. I don’t have one. No one does.
No one can answer these questions since the markets are so vast, no single person has an answer to these questions. Only theories exist. I can tell you some of my more plausible theories.
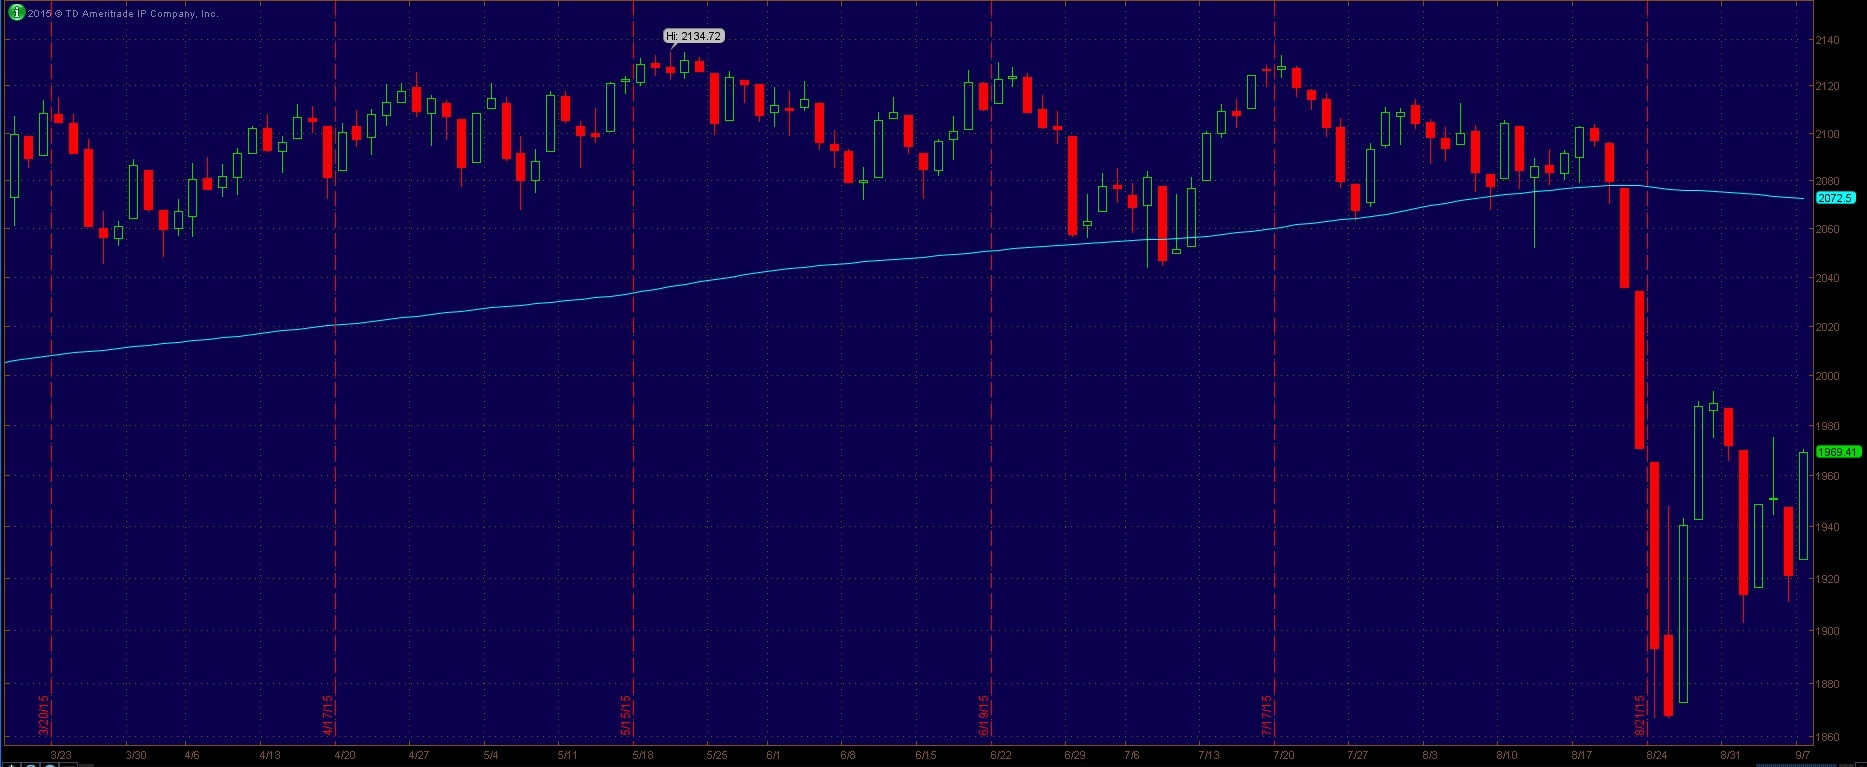
Technical Indicators – S&P 500 Index
I want to point something out to you that is typically not discussed on TV media. Most media channels discuss general news stories and news stories pertaining to the fundamentals of a stock. Very rarely is the topic of technical trading brought up. I cannot speculate as to why this is the case. I can say that on a few specific occasions it was very obvious to me that technical factors seemed to be the most important influence to major market moves, yet the media pointed to other events, some were minor events that had almost nothing to do with the price movements.
In this instance, the media blamed this drop on China. The US economy is not that dependent on China, yet it carved out over 10% on the S&P 500. Look at the S&P 500 in mid to late August 2015.

These two blue arrows show different points where the S&P 500 broke support levels. This may have contributed to the major market moves in the US.
One of these arrows points to the 200-day moving average, which is a widely followed indicator of bull or bear market. When the indexes break below the 200-day moving average, it is seen as an indicator to sell stocks. Above the 200-day moving average is seen as an indicator to buy stocks.
Then right below the 200-day moving average is the support line around 2040. You can see on 2 other occasions in 2015 this line supported the price of the index. Breaking this support on Aug 20th could have caused the S&P 500 to drop further.
Technical trading is more of an art than a science, but at some level so is fundamental investing.
Here is a more obvious chart of the S&P 500 breaking below the 200-day moving average.
Below is a 7-year chart of the S&P 500 with the 200-day moving average. The 200-day moving average seems to provide resistance and support to stock prices. You might also notice that in 2011, the S&P 500 strongly broke this moving average. If you read my prior blog post about Yogi Berra and Deja vu all over again, you will notice that the drop in 2011 looks similar to the S&P 500 right now. There could be a further drop in our future. Only time will tell.

My conclusions
If you are looking for answers to the question of what caused the stock markets to crash in late August, you would be running a fool’s errand. There are no answers, only theories. Above are 30 stock charts of the Dow Jones Industrial Average, the 30 year and 10 year Treasury Note prices, the US Dollar, Euro, Yen, and US stock indexes. All of these investment vehicles are widely used and have a reasonable amount of liquidity. But liquidity quickly drys up in times of stress.
There is a quote that Warren Buffett likes to say, “Only when the tide goes out do you discover who’s been swimming naked.” I think this is a pertinent quote to market liquidity. While the markets may seem normal when they are not under stress, add some unexpected events, and the picture changes.
No one can say for sure what caused the stock market to crash in late August 2015, but there are a number of factors that investors should watch out for moving forward.
- Liquidity– A number of different global markets have shown signs of liquidity drying up. While it seems as if there is plenty of liquidity that exists due to the global central banks’ quantitative easing programs, there still seems to be a lack of it is key areas. Watch for indicators of a lack of liquidity. While this can be a problem, it can also provide a great opportunity for people who are prepared.
- Widening spreads– I haven’t discussed this here, but widening spreads are a sign of market distress.
- Corporate bond yield- Currently corporate bond yields are low, but that may be changing. Many companies are highly leveraged. Declining earnings could put some companies into a dangerous situation where they might not be able to pay their debt burden. Right now the oil and gas and mining sectors are in a precarious position.
- Technical indicators– These are important only in the sense that other traders find them important. By themselves, they are meaningless. But if you assume that everyone else is looking at these are indicators, then it makes them important.
- Economic trends- The economy drives stock prices. A good economy will push the stock markets higher and a slow or declining economy will do the opposite. Economic factors are more important for longer term trends. In the short term, they only influence a small amount of the price movements.
I hope you enjoyed this analysis of the August 2015 stock market crash. I will continue to analyze certain stock and bond market events. If you would like to get these types of posts directly in your inbox, you can sign up for our email list. We will also send you occasional free reports which you might enjoy.
![]()
About the author: Kirk Chisholm is a Wealth Manager and Principal at Innovative Advisory Group. His roles at IAG are co-chair of the Investment Committee and Head of the Traditional Investment Risk Management Group. His background and areas of focus are portfolio management and investment analysis in both the traditional and alternative investment markets. He received a BA degree in Economics from Trinity College in Hartford, CT.