
| Index | Value | 1mo change | 1yr change | 5yr change | Inflation Score |
|---|---|---|---|---|---|
| Economic Inflation | |||||
| Consumer Price Index (CPI) | 238.64 | 0.35% | 0.12% | 9.48% | 2 |
| Producer Price Index (PPI) | 194.00 | -0.36% | -6.73% | 5.38% | 1 |
| 1 Yr Treasury Bill Yield | 0.3% | 0.02 | 0.18 | -0.04 | 2 |
| 10 Yr Treasury Note Yield | 2.34% | -0.03 | 0.19 | 0.01 | 2 |
| Real Interest Rate | 0.43% | 0.11 | 2.27 | 2.22 | 3 |
| US 10 yr TIPS | 0.46% | -0.08 | 0.24 | -0.56 | 2 |
| Capacity utilization | 78.00 | 0.39% | -0.38% | 4.84% | 3 |
| Industrial Production Index | 107.48 | 0.56% | 1.32% | 12.95% | 3 |
| Personal Consumption Expenditure Index | 12,255.3 | 0.21% | 3.24% | 20.55% | 4 |
| Rogers International Commodity Index | 2409.96 | -11.55% | -12.33% | -24.32% | 1 |
| SSA COLA | 0.00% | 1.70% | 3 | ||
| Median Income | $51,939.00 | 1.81% | 3.25% | 3 | |
| Real Median Income | $51,939.00 | 0.35% | -4.56% | 3 | |
| Consumer Interest in Inflation | Stable | 3 | |||
| IAG Inflation Composite | Stable | 3 | |||
| IAG Online Price Index | Mild Inflation | 4 | |||
| US GDP | 17840.50 | 1.08% | 3.30% | 19.82% | 3 |
| S&P 500 | 2098.04 | 0.99% | 6.96% | 92.96% | 4 |
| Market Cap to GDP | 125.10% | 121.20% | 74.30% | 5 | |
| US Population | 321,467 | 0.06% | 0.73% | 4.03% | 2 |
| IAG Economic Inflation Index* | Stable | 3 | |||
| Housing Inflation | |||||
| Median Home price | 236,400.00 | 3.28% | 6.49% | 29.25% | 4 |
| 30Yr Mortgage Rate | 4.05% | 0.07 | -0.08 | -0.51 | 4 |
| Housing affordability | 153.10 | -3.83% | -1.35% | 2 | |
| US Median Rent | 803.00 | 6.22% | 15.71% | 4 | |
| IAG Housing Inflation Index* | Mild Inflation | 4 | |||
| Monetary Inflation | |||||
| US Govt debt held by Fed (B) | 2,793.40 | 0.94% | 26.47% | 259.70% | 1 |
| US Debt as a % of GDP (B) | 102.85% | 0.09% | 1.09% | 14.18% | 2 |
| M2 Money Stock (B) | 12,005.50 | 0.49% | 5.78% | 40.43% | 4 |
| Monetary Base (B) | 3,994.00 | 1.22% | -0.49% | 97.96% | 3 |
| Outstanding US Gov’t Debt (B) | 18,152.056 | 0.06% | 3.13% | 42.11% | 4 |
| Total Credit Market Debt (B) | 59,045.73 | 0.56% | 3.42% | 14.00% | 4 |
| Velocity of Money [M2] | 1.49 | -0.20% | -2.48% | -14.09% | 2 |
| US Trade Balance | -41,839.00 | -7.08% | -3.46% | 5.84% | 1 |
| Big Mac Index | Expensive | 1 | |||
| US Dollar | 97.34 | 2.04% | 19.39% | 19.33% | 1 |
| IAG Monetary Inflation Index* | Mild Deflation | 2 | |||
| Energy | |||||
| Electricity (cents / KW hour) | 12.95 | -1.75% | 0.86% | 3 | |
| Coal (CAPP) | 49.95 | -8.85% | -12.75% | -28.90% | 1 |
| Oil | 46.77 | -7.46% | -52.13% | -40.78% | 1 |
| Natural Gas | 2.71 | -5.44% | -29.12% | -44.63% | 1 |
| Gasoline | 1.68 | -11.93% | -39.68% | -20.72% | 1 |
| IAG Energy Inflation Index* | Strong Deflation | 1 | |||
| Food and Essentials | |||||
| Wheat | 498.25 | -18.92% | -6.08% | -28.02% | 2 |
| Corn | 381.75 | -11.07% | 4.09% | -6.15% | 4 |
| Soybeans | 939.50 | -9.21% | -12.79% | -6.56% | 1 |
| Orange Juice | 123.35 | 4.49% | -11.70% | -15.86% | 1 |
| Sugar | 11.15 | -7.47% | -32.18% | -43.11% | 1 |
| Live Cattle | 146.45 | -1.31% | -6.68% | 54.73% | 2 |
| Cocoa | 3203 | -1.48% | -0.22% | 3.96% | 3 |
| Coffee | 125.90 | -3.15% | -35.72% | -28.16% | 1 |
| Cotton | 64.11 | -5.27% | -6.74% | -18.50% | 2 |
| Stamps | $0.49 | 0.00% | 6.52% | 11.36% | 4 |
| CRB Foodstuffs Index | 360.64 | -4.07% | -16.08% | -4.27% | 1 |
| IAG Food and Essentials Inflation Index* | Strong Deflation | 1 | |||
| Construction and Manufacturing | |||||
| Copper | 2.35 | -9.81% | -27.13% | -28.88% | 1 |
| Lumber | 252.30 | -12.70% | -22.44% | 21.30% | 1 |
| Aluminum | 0.72 | -4.00% | -20.88% | -19.10% | 1 |
| CRB Raw Industrials | 448.52 | -2.92% | -15.45% | -8.38% | 1 |
| Total Construction Spending (M) | 1,064,594.00 | 0.10% | 12.03% | 33.40% | 5 |
| ISM Manufacturing Index | 52.70 | -1.50% | -6.56% | -6.56% | 1 |
| IAG Construction & Manufacturing Index* | Strong Deflation | 1 | |||
| Precious Metals | |||||
| Gold | 1,095.00 | -6.60% | -14.60% | -7.50% | 1 |
| Silver | 15.62 | -0.03% | -23.53% | -13.25% | 1 |
| IAG Precious Metals Inflation Index* | Strong Deflation | 1 | |||
| Innovative Advisory Group Index | |||||
| IAG Inflation Index Composite* | Mild/Strong Deflation | 1 / 2 | |||
* If you would like a description of terms, calculations, or concepts, please visit our Inflation monitor page to get additional supporting information. We will continually add to this page to provide supporting information.
* Our Inflation Score is based on a proprietary algorithm, which is meant to describe the respective category by a simple number. The scores range from 1-5. One (1) being the most deflationary. Five (5) being the most inflationary. These scores are meant to simplify each item and allow someone to quickly scan each item or section to see the degree of which inflation or deflation is present.
* We have also added our own indexes to each category to make it even easier for readers to receive a summary of information.
Inflation Monitor Summary – Composite Ranking

* The Inflation Equilibrium is a quick summary for the whole data series of the inflation monitor. If you don’t like statistics, this is the chart for you.
Inflation Monitor – August 2015 – Introduction
The lazy days of summer are almost over. As the summer ends, the Wall Street traders and money managers will also be going back to work. If you looked at a chart of the S&P 500 without the dates, you would not be able to tell which days were summer days and which were not. It looks like the traders have been on vacation for the entire year.
The S&P 500 has been fluctuating around 0% all year long. It is kind of refreshing to know that there is another direction other than straight up. The end of the year has a chance to be very interesting considering the speculation that the Federal Reserve will be raising rates. While I have said many times I think the Fed will lock the floating rate of 0%-.25% at .25% as a starting point, this will amount to nothing. This might even be a catalyst for the market to resume its march higher, if the Fed says that they will stop and assess the market’s reaction before raising again.
The US stock market is already very overpriced according to a number of metrics, but until there is a better place for investors to put their money, it may remain expensive. The Chinese stock market has been unraveling in the past few months and this may be a catalyst to move global markets. It is too soon to tell. Keep watching Chinese markets as a sign of trouble ahead.
The rise in interest rates has cast some interesting speculation on the future movements of the stock market. I want to dispel some of the myths about the rise in interest rates. In short, historical data suggests that the stock market rises with the rising rates, but what is not explained is that the rates start rising to stop the excessive rise in the stock markets. In fact, in recent history, the Fed has raised interest rates until the stock market slows. Inevitably the Fed overshoots the mark and causes the market to decline. The US has had 0% interest rates since 2009. This is a long time with low rates. I am surprised the market is not higher.
This month’s inflation monitor data once again show the US market is experiencing deflation. I have not heard more than a handful of people discussing this deflationary data. I am wondering when more people are going to recognize this fact. I suppose that will be when the markets turn, then everyone will have seen it.
Small Businesses are important to the economy
Small businesses are what drive the US economy, not big businesses. ADP, the payroll processing company, compiles data on employment in the US private sector of the labor market. This is segmented by size. From Jan 2005 to June 2015, small companies (1-49 employees) added 5.1 million workers with payrolls totaling 50.2 million. Med-sized companies (50-499 employees) added 3.8 million workers with payrolls totaling 43.0 million. Large companies (500+ workers) removed 234,000 from their payroll totaling 26.5 million. According to ADP, the small and mid-sized companies account for 42% and 36% of private payrolls. Large companies account for only 22% of private payrolls. This number has been reduced by 24% since Jan 2005.
The question that voters should be asking their respective politicians is why are the benefits mainly going to large corporations when small and mid sized firms are the ones who are guiding our economy. These same businesses are telling the National Federation of Independent Businesses (NFIB) that their biggest problems are taxes and government regulations. As Governor Padilla of Puerto Rico stated recently, “this is not about politics, its about math.”
I hope you enjoy this month’s Inflation Monitor – August 2015.
Kirk Chisholm
As always, please contact me with any questions or to send your feedback. Thank you for reading.
Join our email list to receive the Inflation Monitor sent directly to your inbox.
![]()
Charts of the Month
Leading Indicators
Dr. Copper
More of the same from last month. Traditionally copper is a good leading indicator. Dr. Copper is still weak. There is too much global supply of copper for this to get much traction. However, this seems to be true for many commodities. It is not clear if the supply glut in copper is causing it to produce false signals for a weakening economy. time will tell. The chart sure seems ominous.

Financials
Financial are still going strong.

US Real Estate
Despite the lower cost of buying real estate in the past few years, more people are looking to rent than buy. While this is a typical behavior for people who are expecting deflation, it is interesting to note.
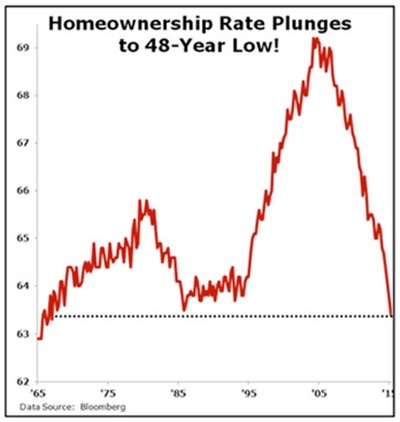
This should be an interesting trend to watch.
What price of oil will allow the following countries to balance the budget?

Producer Price Index (PPI)

Consumer Price Ratio (CPI)

Historical Average Real Annual Returns
This is a chart shows the real returns over time.

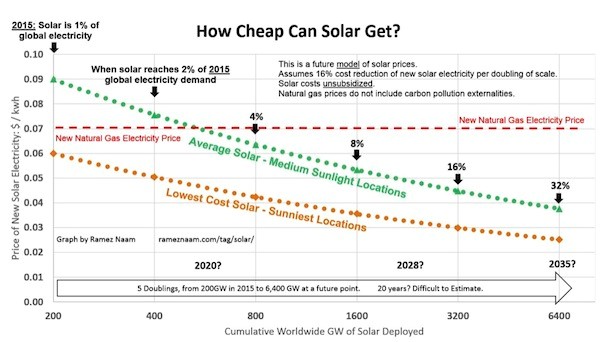
Moore’s Law applied to Solar Energy
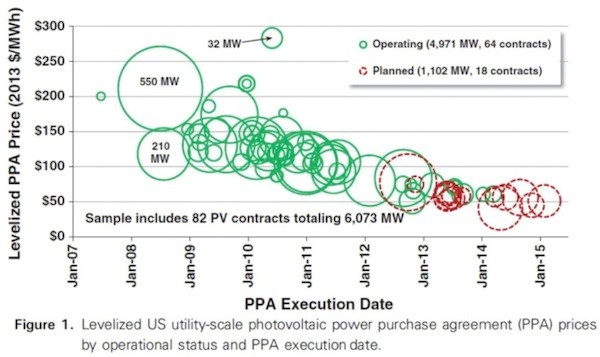
Cost of Solar Energy
Similar scale applied to the automobile
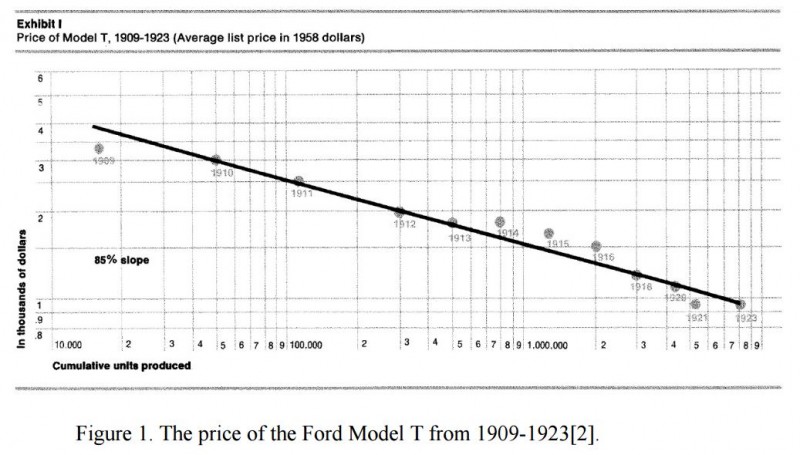
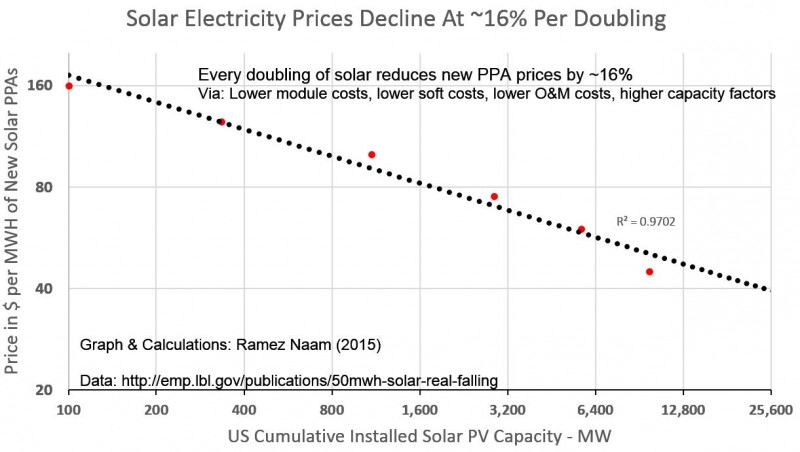
Solar Electricity price declines
Based on these charts solar electricity will eventually be cost effective as an alternative energy source. It will still take some time for this change to happen. This is still 15-20 years out.
US Velocity of Money M2
This is not turning up. This is a bad sign since it means people are not spending money… thus no inflation. Next time someone tells you hyper inflation is around the corner, just show them this chart and ask them where this hypothetical inflation is.

China
China is still having a rough time with their equity markets. Last week they devalued their currency to compete with other countries. They devalued the Yuan by ~2% to help with their exports. Their economy which I have long speculated has been a house of cards, seems to be finally unraveling. Caution would be advised. I would put their economy in the same category as Greece, highly speculative, but they are both there for different reasons.
I will point out that despite the calls for the Yuan to implode, there is a significant difference between the Yuan, Real, Euro, Australian Dollar and the US Dollar. In the past year compared to the US dollar, the Yuan has dropped about -2.5%, the Euro about -18%, the Australian Dollar -22%, and the Brazil Real about – 36%. Time will tell what the path is to the Global Currency Wars, but this is certainly a step in the direction of the US Dollar continuing to increase in value.

Gas Prices in Massachusetts
Massachusetts gas prices are still rather high compared to the rest of the country, but much better than California. The price scale changes each month, so don;t compare the colors.

Gas Prices in the US
California is still out of touch with the rest of the country. I guess that may always be true. The price scale for the US map has changed from last month as well, so don’t compare the colors.

Currency Relative Valuations to Gold
Gold prices are they strong or weak?

Gold Priced in Euros

Gold Priced in Yen

Gold Priced in Canadian Dollars

Gold Priced in Australian Dollars
Bonds
High Yield Bonds (Junk Bonds)
This can be a leading indicator for the equity markets. This is leading us in the wrong direction.

Baltic Dry Index
The Baltic Dry Index has continued to pick up in the past few months, but it still has a long way to go. While this index tends to be volatile, it is going in the right direction

I hope you enjoyed this month’s Inflation Monitor. See you next month.
Cheers,
![]()
Kirk Chisholm
The IAG Inflation Monitor – Subscription Service
We are initially publishing this Inflation Monitor as a free service to anyone who wishes to read it. We do not always expect this to be the case. Due to the high demand for us to publish this service, we plan to offer it free for a while and when we feel we have fine tuned it enough, we do plan on charging for access. Our commitment to our wealth management clients is to always provide complimentary access to our research. If you would like to discuss becoming a wealth management client, feel free to contact us.
If you would like to automatically receive the Inflation Monitor in your email inbox each month, click here to join our free subscription service.
![]()
Sources:
- Federal Reserve – St. Louis
- U.S. Energy Information Administration
- U.S. Post Office
- National Association of Realtors
- The Economist
- The Commodity Research Bureau
- Gurufocus.com
- Stockcharts.com
- GasBuddy
* IAG index calculations are based on publicly available information.
** IAG Price Composite indexes are based on publicly available information.
About Innovative Advisory Group: Innovative Advisory Group, LLC (IAG), an independent Registered Investment Advisory Firm, is bringing innovation to the wealth management industry by combining both traditional and alternative investments. IAG is unique in that we have an extensive understanding of the regulatory and financial considerations involved with self-directed IRAs and other retirement accounts. IAG advises clients on traditional investments, such as stocks, bonds, and mutual funds, as well as advising clients on alternative investments. IAG has a value-oriented approach to investing, which integrates specialized investment experience with extensive resources.
For more information, you can visit: innovativewealth.com
About the author: Kirk Chisholm is a Wealth Manager and Principal at Innovative Advisory Group. His roles at IAG are co-chair of the Investment Committee and Head of the Traditional Investment Risk Management Group. His background and areas of focus are portfolio management and investment analysis in both the traditional and non-traditional investment markets. He received a BA degree in Economics from Trinity College in Hartford, CT.
Disclaimer: This article is intended solely for informational purposes only, and in no manner intended to solicit any product or service. The opinions in this article are exclusively of the author(s) and may or may not reflect all those who are employed, either directly or indirectly or affiliated with Innovative Advisory Group, LLC.