
| Index | Value | 1mo change | 1yr change | 5yr change | Inflation Score |
|---|---|---|---|---|---|
| Economic Inflation | |||||
| Consumer Price Index (CPI) | 236.12 | 0.60% | -0.07% | 8.50% | 1 |
| Producer Price Index (PPI) | 191.60 | 0.26% | -7.44% | 4.53% | 1 |
| 1 Yr Treasury Bill Yield | 0.25% | 0.03 | 0.12 | -0.15 | 2 |
| 10 Yr Treasury Note Yield | 1.87% | -0.10 | -0.84 | -1.98 | 2 |
| Real Interest Rate | 0.32% | 0.08 | 1.71 | 2.24 | 3 |
| US 10 yr TIPS | 0.07% | -0.18 | -0.47 | -1.43 | 2 |
| ISM Manufacturing Index | 51.50 | -2.65% | -5.33% | -12.41% | 2 |
| Capacity utilization | 78.40 | -0.63% | -0.88% | 8.74% | 3 |
| Industrial Production Index | 105.22 | -0.64% | 2.05% | 18.36% | 4 |
| Personal Consumption Expenditure Index | 12,105.30 | 0.10% | 3.34% | 20.63% | 3 |
| Rogers International Commodity Index | 2551.33 | -5.49% | -7.19% | -20.27% | 1 |
| SSA COLA | 0.00% | 1.70% | 3 | ||
| Median Income | $51,939.00 | 1.81% | 3.25% | 3 | |
| Real Median Income | $51,939.00 | 0.35% | -4.56 | 3 | |
| Consumer Interest in Inflation | Stable | 3 | |||
| IAG Inflation Composite | Mild Deflation | 2 | |||
| IAG Online Price Index | -1.59% | -0.69% | 9.90% | 2 | |
| US GDP | 17703.70 | 0.59% | 3.66% | 21.56% | 4 |
| S&P 500 | 2117.39 | -2.73% | 9.24% | 74.83% | 5 |
| Market Cap to GDP | 124.00% | 118.50% | 85.20% | 5 | |
| US Population | 320,534 | 0.05% | 0.73 | 4.06% | 2 |
| IAG Economic Inflation Index* | Mild Deflation | 2 | |||
| Housing Inflation | |||||
| Median Home price | 212,100.00 | 5.05% | 7.83% | 25.06% | 5 |
| 30Yr Mortgage Rate | 3.77% | 0.05 | -0.57 | -1.20 | 4 |
| Housing affordability | 177.60 | -0.39% | 1.30% | 3 | |
| US Median Rent | 766.00 | 2.68% | 12.65% | 3 | |
| IAG Housing Inflation Index* | Mild Inflation | 4 | |||
| Monetary Inflation | |||||
| US Govt debt held by Fed (B) | 2,705.90 | 3.49% | 39.72% | 312.17% | 1 |
| US Debt as a % of GDP (B) | 102.47% | 1.20% | 0.87% | 17.95% | 2 |
| M2 Money Stock (B) | 11,926.00 | 0.90% | 6.12% | 39.45% | 4 |
| Monetary Base (B) | 4,064.36 | 5.60% | 3.96% | 93.73% | 3 |
| Outstanding US Gov’t Debt (B) | 18,141,444 | 1.78% | 4.55% | 47.36% | 4 |
| Total Credit Market Debt (B) | 58,715.58 | 1.27% | 3.58% | 12.50% | 4 |
| Velocity of Money [M2] | 1.53 | -0.52% | -1.92% | -11.15% | 1 |
| US Trade Balance | -35,444.00 | 16.95% | 15.39% | 13.62% | 2 |
| Big Mac Index | Expensive | 1 | |||
| US Dollar | 98.49 | 3.27% | 22.70% | 21.68% | 1 |
| IAG Monetary Inflation Index* | Mild Deflation | 2 | |||
| Energy | |||||
| Electricity (cents / KW hour) | 12.10 | -0.41% | 3.86% | 4 | |
| Coal (CAPP) | 53.06 | 0.00% | -10.16% | -13.16% | 1 |
| Oil | 47.49 | -3.96% | -53.23% | -43.24% | 1 |
| Natural Gas | 2.60 | -3.38% | -40.46% | -32.89% | 1 |
| Gasoline | 1.77 | -10.38% | -39.21% | -22.92% | 1 |
| IAG Energy Inflation Index* | Strong Deflation | 1 | |||
| Food and Essentials | |||||
| Wheat | 530.50 | 3.31% | -23.72% | 17.76% | 1 |
| Corn | 376.25 | -3.90% | -24.98% | 9.06% | 1 |
| Soybeans | 972.75 | -6.01% | -33.51% | 3.48% | 1 |
| Orange Juice | 124.50 | 3.11% | -14.49% | -8.12% | 1 |
| Sugar | 12.00 | -13.23% | -32.47% | -27.71% | 1 |
| Pork | 62.00 | -8.55% | -50.73% | -23.17% | 1 |
| Cocoa | 2704.00 | -10.05% | -8.18% | -8.56% | 2 |
| Coffee | 132.65 | -6.12% | -25.06% | -2.86% | 1 |
| Cotton | 63.10 | -2.22% | -32.17% | -22.07% | 1 |
| Stamps | $0.49 | 0.00% | 6.52% | 11.36% | 4 |
| CRB Foodstuffs Index | 347.69 | -2.37% | -20.20% | 0.00% | 1 |
| IAG Food and Essentials Inflation Index* | Strong Deflation | 1 | |||
| Construction and Manufacturing | |||||
| Copper | 2.74 | 1.59% | -9.48% | -23.07% | 2 |
| Lumber | 221.00 | -25.51% | -34.40% | -27.56% | 1 |
| Aluminum | 0.83 | 5.06% | 1.22% | -14.43% | 3 |
| CRB Raw Industrials | 468.52 | -0.64% | -13.30% | -7.36% | 1 |
| Total Construction Spending (M) | 967,170.00 | -0.08% | 2.12% | 11.08% | 3 |
| IAG Construction & Manufacturing Index* | Mild Deflation | 2 | |||
| Precious Metals | |||||
| Gold | 1,185.50 | -2.33% | -7.71% | 7.22% | 2 |
| Silver | 16.62 | 0.27% | -15.87% | -5.06% | 1 |
| IAG Precious Metals Inflation Index* | Strong Deflation | 1 | |||
| Innovative Advisory Group Index | |||||
| IAG Inflation Index Composite* | Mild/Strong Deflation | 2 | |||
* If you would like a description of terms, calculations, or concepts, please visit our Inflation monitor page to get additional supporting information. We will continually add to this page to provide supporting information.
* Our Inflation Score is based on a proprietary algorithm, which is meant to describe the respective category by a simple number. The scores range from 1-5. One (1) being the most deflationary. Five (5) being the most inflationary. These scores are meant to simplify each item and allow someone to quickly scan each item or section to see the degree of which inflation or deflation is present.
* We have also added our own indexes to each category to make it even easier for readers to receive a summary of information.
Inflation Monitor Summary – Composite Ranking

* The Inflation Equilibrium is a quick summary for the whole data series of the inflation monitor. If you don’t like statistics, this is the chart for you.
Inflation Monitor – April 2015 – Introduction
Spring is finally here and with it comes the warm weather. Unfortunately, the warm weather has not been able to thaw out deflation or the wintery economic chill that has gripped certain parts of the US economy and many European nations.
The CPI continues to hit negative territory on an annual basis for the second month in a row. The PPI is well into negative territory as well. This does not bode well for the US economy.
Commodity prices have also continued to show weakness. The bright spot in the US economy is housing which has been climbing for the past few months and started to pick up its pace.
There are many excuses that have been proposed for these numbers: the heavy snowfall in the North East this past winter, the significant drop in oil prices, the rising US Dollar, and more. These are all valid reasons for the drop in the CPI, PPI, and other economic data. However what I find amusing is the commentators who claim the high oil prices were a good thing for the economy, now say that low oil prices are good for the economy… Well, which is it?
The stock market is not the economy” – Author Unknown
This axiom is more important than any you will learn about the stock market. What it means is that the economy does not always lead or follow the actions of the stock market. While they are obviously related, they are not the same.
The US stock market is currently holding up well considering the negative economic data. While the two are highly correlated, they do not always act in unison. However, I do expect the stock market to follow the economic trends in the second half of this year unless we see a sharp reversal in the trend of the US Dollar and Oil.
In this month’s Inflation Monitor I have some very interesting charts to share with you. Enjoy.
As always, please contact me to send your feedback on how I can make this monthly Inflation Monitor a better tool and resource for you. Thank you for reading and I hope you enjoy this month’s issue – Inflation Monitor – April 2015.
Join our email list to receive the Inflation Monitor sent directly to your inbox.
![]()
Kirk Chisholm
Charts of the Month
Here are some charts I found interesting in the past month.
Congratulations to the Swiss Government for breaking a record
According to the Wall Street Journal, the Swiss Government is the first country ever to issue a 10-year bond with a negative rate. Just so you understand the reality of what this means. The Swiss government borrowed money from investors and will make money each year. For a further description of this type of loan, you can read more about negative interest rates here.

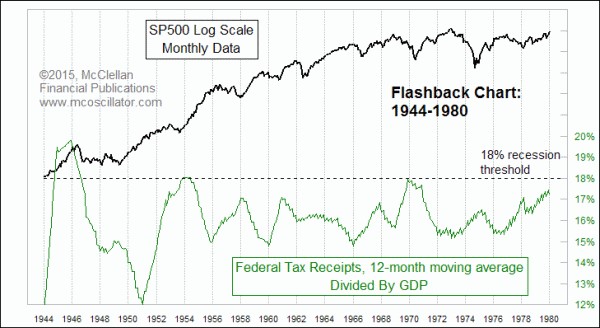
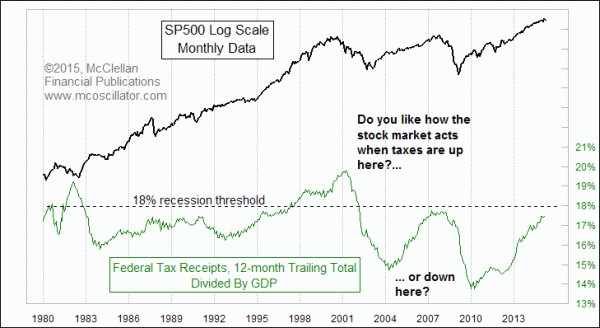
US Government Tax Receipts
This is a great chart from McClellan detailing the Federal Government’s tax receipts. It would seem that 18% moving average divided by GDP is the high watermark. We are certainly close enough to exercise caution at this point. However, if you have been reading the past few months, you will note that there are a number of indicators that are troubling.
US Inflation
This chart shows US Core Inflation compared to other components. It looks like there are two obvious problems on this chart. If you can’t figure out which ones I am referring to, wait 10 years and let me know if they are affordable to anyone.

While I have not written a post about this yet, I am planning on it. The higher educational system is going to undergo a major change in the next decade in part because of this trend, but also due to the technology which is available to offer alternatives. I suspect there will be a 2-tiered system.
Currency Wars
The term “currency wars” has graced the headlines of most media outlets for the past few months. Why wouldn’t it? The media gets to talk about another war with all the hype that goes along with that parade. But this one is not actually happening. It has been clear to me since 2008 that the “currency wars” are not wars at all, but rather a coordinated effort by the central banks to work together rather than fight each other. Great idea on their part right?
While there is much more volatility in the currency markets than is historically considered normal, the volatility would be much higher if the global central banks were “fighting”. Regardless of their public rhetoric, the currency moves seem to be done in a rational and meaningful way. As my kids would say, they are “taking turns” at the water fountain of a cheap currency. The US had a long run of cheap currency which has helped strengthen their economy. I would assume strong enough to bear the weight of a strong US Dollar.
This strong US Dollar will allow other countries in Europe and Asia to take their turn with a weak currency to strengthen their economy.
This strong dollar will inevitably cause a drag on US corporate earnings, but how much is still up for debate.
The US has 15% of its GDP coming from exports, while Germany, China, Switzerland, and Finland have about 40% of their GDP coming from exports. This is why it is important for Europe to have a weak currency right now considering the recession they are heading into along with deflation.
Here are some US Dollar currency pairs:


Buying a Home: Rent vs Own


Gas Prices in Massachusetts
Once again Massachusetts gas prices are still elevated more than they should be. I’m sure the savings from lower prices will eventually be passed along to the consumer. Just not anytime soon. Average Gas Prices in Boston is $2.38… This station is in Belmont. The RBOB Gas Futures are priced at $1.7678. That is a nice spread selling gas.

Gold prices are they strong or weak?

Gold Priced in Euros

Gold Priced in Yen

Gold Priced in Canadian Dollars

Gold Priced in Australian Dollars

Baltic Dry Index
We have the lowest reading, well below 2009 lows, since 2003. I’m not surprised, but it certainly is interesting.

Velocity of Money
If you have been reading this service for a few months and are wondering why there is no inflation. You can stop searching. Here is where it has disappeared to… Down the rabbit hole to historical lows.
Don’t be persuaded by hype and rhetoric about how the US will have high inflation. I won’t be worried about inflation until this chart starts to turn around… or at least stops falling like a safe out a window.

I hope you enjoyed this month’s Inflation Monitor. See you next month.
Cheers,
![]()
Kirk Chisholm
The IAG Inflation Monitor – Subscription Service
We are initially publishing this Inflation Monitor as a free service to anyone who wishes to read it. We do not always expect this to be the case. Due to the high demand for us to publish this service, we plan to offer it free for a while and when we feel we have fine tuned it enough, we do plan on charging for access. Our commitment to our wealth management clients is to always provide complimentary access to our research. If you would like to discuss becoming a wealth management client, feel free to contact us.
If you would like to receive the Inflation Monitor in your email inbox each month, click here to join our subscription service.
![]()
Sources:
- Federal Reserve – St. Louis
- U.S. Energy Information Administration
- U.S. Post Office
- National Association of Realtors
- The Economist
- The Commodity Research Bureau
- Gurufocus.com
- Stockcharts.com
- GasBuddy
* IAG index calculations are based on publicly available information.
** IAG Price Composite indexes are based on publicly available information.
About Innovative Advisory Group: Innovative Advisory Group, LLC (IAG), an independent Registered Investment Advisory Firm, is bringing innovation to the wealth management industry by combining both traditional and alternative investments. IAG is unique in that we have an extensive understanding of the regulatory and financial considerations involved with self-directed IRAs and other retirement accounts. IAG advises clients on traditional investments, such as stocks, bonds, and mutual funds, as well as advising clients on alternative investments. IAG has a value-oriented approach to investing, which integrates specialized investment experience with extensive resources.
For more information, you can visit http://innovativewealth.com
About the author: Kirk Chisholm is a Wealth Manager and Principal at Innovative Advisory Group. His roles at IAG are co-chair of the Investment Committee and Head of the Traditional Investment Risk Management Group. His background and areas of focus are portfolio management and investment analysis in both the traditional and non-traditional investment markets. He received a BA degree in Economics from Trinity College in Hartford, CT.
Disclaimer: This article is intended solely for informational purposes only, and in no manner intended to solicit any product or service. The opinions in this article are exclusively of the author(s) and may or may not reflect all those who are employed, either directly or indirectly or affiliated with Innovative Advisory Group, LLC.